Stem and Leaf Plot
Overview: You will learn how to read a stem and leaf plot and what it means. Stem and leaf plots help you analyze large amounts of data that is to big for data tables. It is a simpler way to visualize data.
Examples; How much rainfall and the temperature over a period of time, scores on a test, or scores on sports teams.
Examples; How much rainfall and the temperature over a period of time, scores on a test, or scores on sports teams.
Steps
Step 1: Place your numbers in order from Least to Greatest
Ex. 180, 240, 260, 270, 310, 330, 360, 370, 390, 410, 480, 500, 710, 730, 890
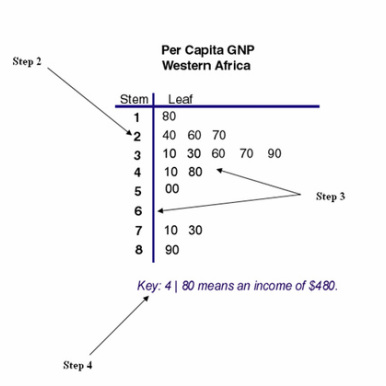
Step 2: Find the range (Definition:largest number to the smallest number) by looking at the first number and the last number in the example above. Seeing that 180 is the first number and 890 is the last number, this will give you your range going down the Stem side of 1-8.
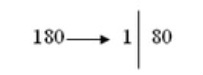
Step 3: Place the numbers in order Putting the tens (the first number in the digit) on the Stem side and the ones (the last 2 numbers) on the Leaf side.
Ex. Shown on the picture below
Ex. 180, 240, 260, 270, 310, 330, 360, 370, 390, 410, 480, 500, 710, 730, 890
Step 2: Find the range (Definition:largest number to the smallest number) by looking at the first number and the last number in the example above. Seeing that 180 is the first number and 890 is the last number, this will give you your range going down the Stem side of 1-8.
Step 3: Place the numbers in order Putting the tens (the first number in the digit) on the Stem side and the ones (the last 2 numbers) on the Leaf side.
Ex. Shown on the picture below
Step 4: Put a key to indicate the meaning of the stem and leaf numbers. This is needed to show you what each number means.
Ex. Key: 4/80 means an income of $480
Ex. Key: 4/80 means an income of $480