Solving Equations
Overview: In this lesson you will learn Linear equations. you will also learn how to graph linear equations.
What Is It? Linear Equations A linear equation looks like any other equation. It is made up of two expressions set equal to each other.
- It has one or two variables.
- No variable in a linear equation is raised to a power greater than 1 or used as the denominator of a fraction.
- When you find pairs of values that make the linear equation true and plot those pairs on a coordinate grid, all of the points for any one equation lie on the same line. Linear equations graph as straight lines.
Example
Step 2:
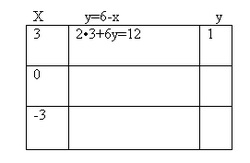
Fill in x in the second column, first row, and solve the problem.
Step 4:
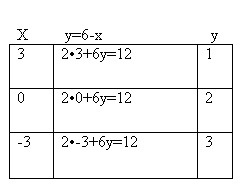
Do the same thing as step 2 accept for row 3.
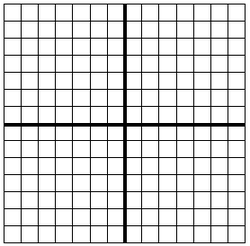
Step 6:
Fill out what you have on the graph.
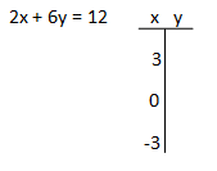
Step 1:
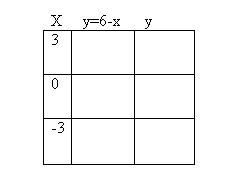
Make a chart that has 3 columns and 3 rows. the first column is the x column, the second column is the equation, and the third is the x column.
Step 3:
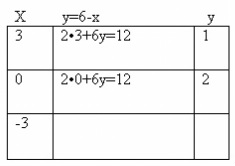
Do the same thing as step 2 accept for row 2.
Step 5:
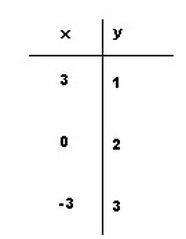
Since you have your chart is filled out, fill out the table.
Step A:
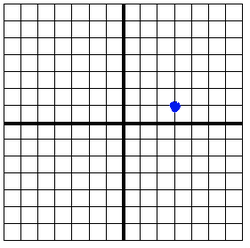
The first integers are 3,1. So, start in the middle of the graph, go over 3 and up 1. Make a dot.
Step B:
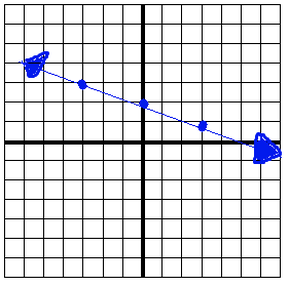
Do the same thing for the other set of integers and draw a line.
FINISHED!
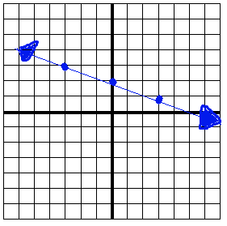
Now you have graphed a linear equation!
